Effectiveness of social distancing strategies for protecting a community from a pandemic with a data-driven contact network based on census and real-world mobility data
Authors: David Martín-Corral (1,4), Alberto Aleta (2, 3), Alex Pentland (5), Yamir Moreno (2,3), Esteban Moro (1,5).
(1) University Carlos III de Madrid, Leganés, Spain.
(2) Institute for Biocomputation and Physics of Complex Systems, University of Zaragoza, Zaragoza, Spain.
(3) ISI Foundation, Turin, Italy.
(4) Zensei Technologies S.L., Madrid, Spain.
(5) Connection Science, Institute for Data Science and Society, MIT, Cambridge, US.
Notice: These results are preliminary and they have not yet been peer-reviewed. We will be updating them with new results and analysis. This work is licensed under a Creative Commons Attribution 4.0 International License.
A extended version of this report can be downloaded here.
Key findings
-
School closures do not have a major impact on controlling the epidemic, despite closing them, infections keep occurring within the households and the community layers.
-
Passive social distance strategies are not enough to contain the epidemic, active strategies need to be established. For instance, large scale testing, remote symptoms monitoring, isolation and contact tracing.
-
School closures and Self distancing at 90% of adoption is a feasible strategy for minimizing the effects of the epidemic, but only if they are applied for a large period of time.
-
A full confinement is not feasible and will not solve the problem without active measures in place after the confinement, since there would be a new outbreak.
-
If high resolution mobility data is available, our data-driven approach with real world data can be easily replicated for new cities or countries to measure the impact of social distance strategies and the epidemic.
Abbrevations
- ILI = Influenza-like Illness
- SIR = Susceptible Infected Recovered
- SEIR = Susceptieble Exposed Infected Recovered
Background
The current situation of emergency is global. As of today, March 22nd 2020, there are more than 23 countries with more than 1.000 infected cases by COVID-19, in the exponential growth phase of the disease.
Furthermore, there are different mitigation and suppression strategies in place worldwide, but many of them are based on enforcing, to a more or less extent, the so-called social distancing.
The impact and outcomes of the adopted measures are yet to be contrasted and quantified. Therefore, realistic modeling approaches could provide important clues about what to expect and what could be the best course of actions. Such modeling efforts could potentially save thousands, if not millions of lives.
Our report contains preliminary results that aim at answering the following questions in relation to the spread and control of the COVID-19 pandemic:
-
What is the expected impact of current social distancing strategies?
-
How long should such measures need to be in place?
-
How many people will be infected and at which social level?
-
How do R(t) and the epidemic dynamic change based on the adopted strategies?
-
What is the probability of having a second outbreak, i.e., a reemergence?
-
If there is a reemergence, how much time do we have to get ready?
-
What is the best strategy to minimize the current epidemic and get ready for a second wave?
In this report, we provide details of the data analyzed, the methodology (and its limitations) employed as well as a quantitative and qualitative assessment of strategies based on social distancing and corresponding what-if-scenarios for control and mitigation.
Data & Methods
Mobility and synthetic data for building the contact network
We used de-identified mobility data and sociodemographic data from the Boston area, from Cubeiq and US Census, respectively. The de-identified mobility data is from users who opted in to share their data anonymously.
We use it to generate one network describing the contact patterns of about 100.000 agents in the Boston area during a period of four months and three layers (Community, Households and Schools).
The community layer is based on mobility data, the households layer is built from census data, and finally, the schools layer is based on the geographical location of children.
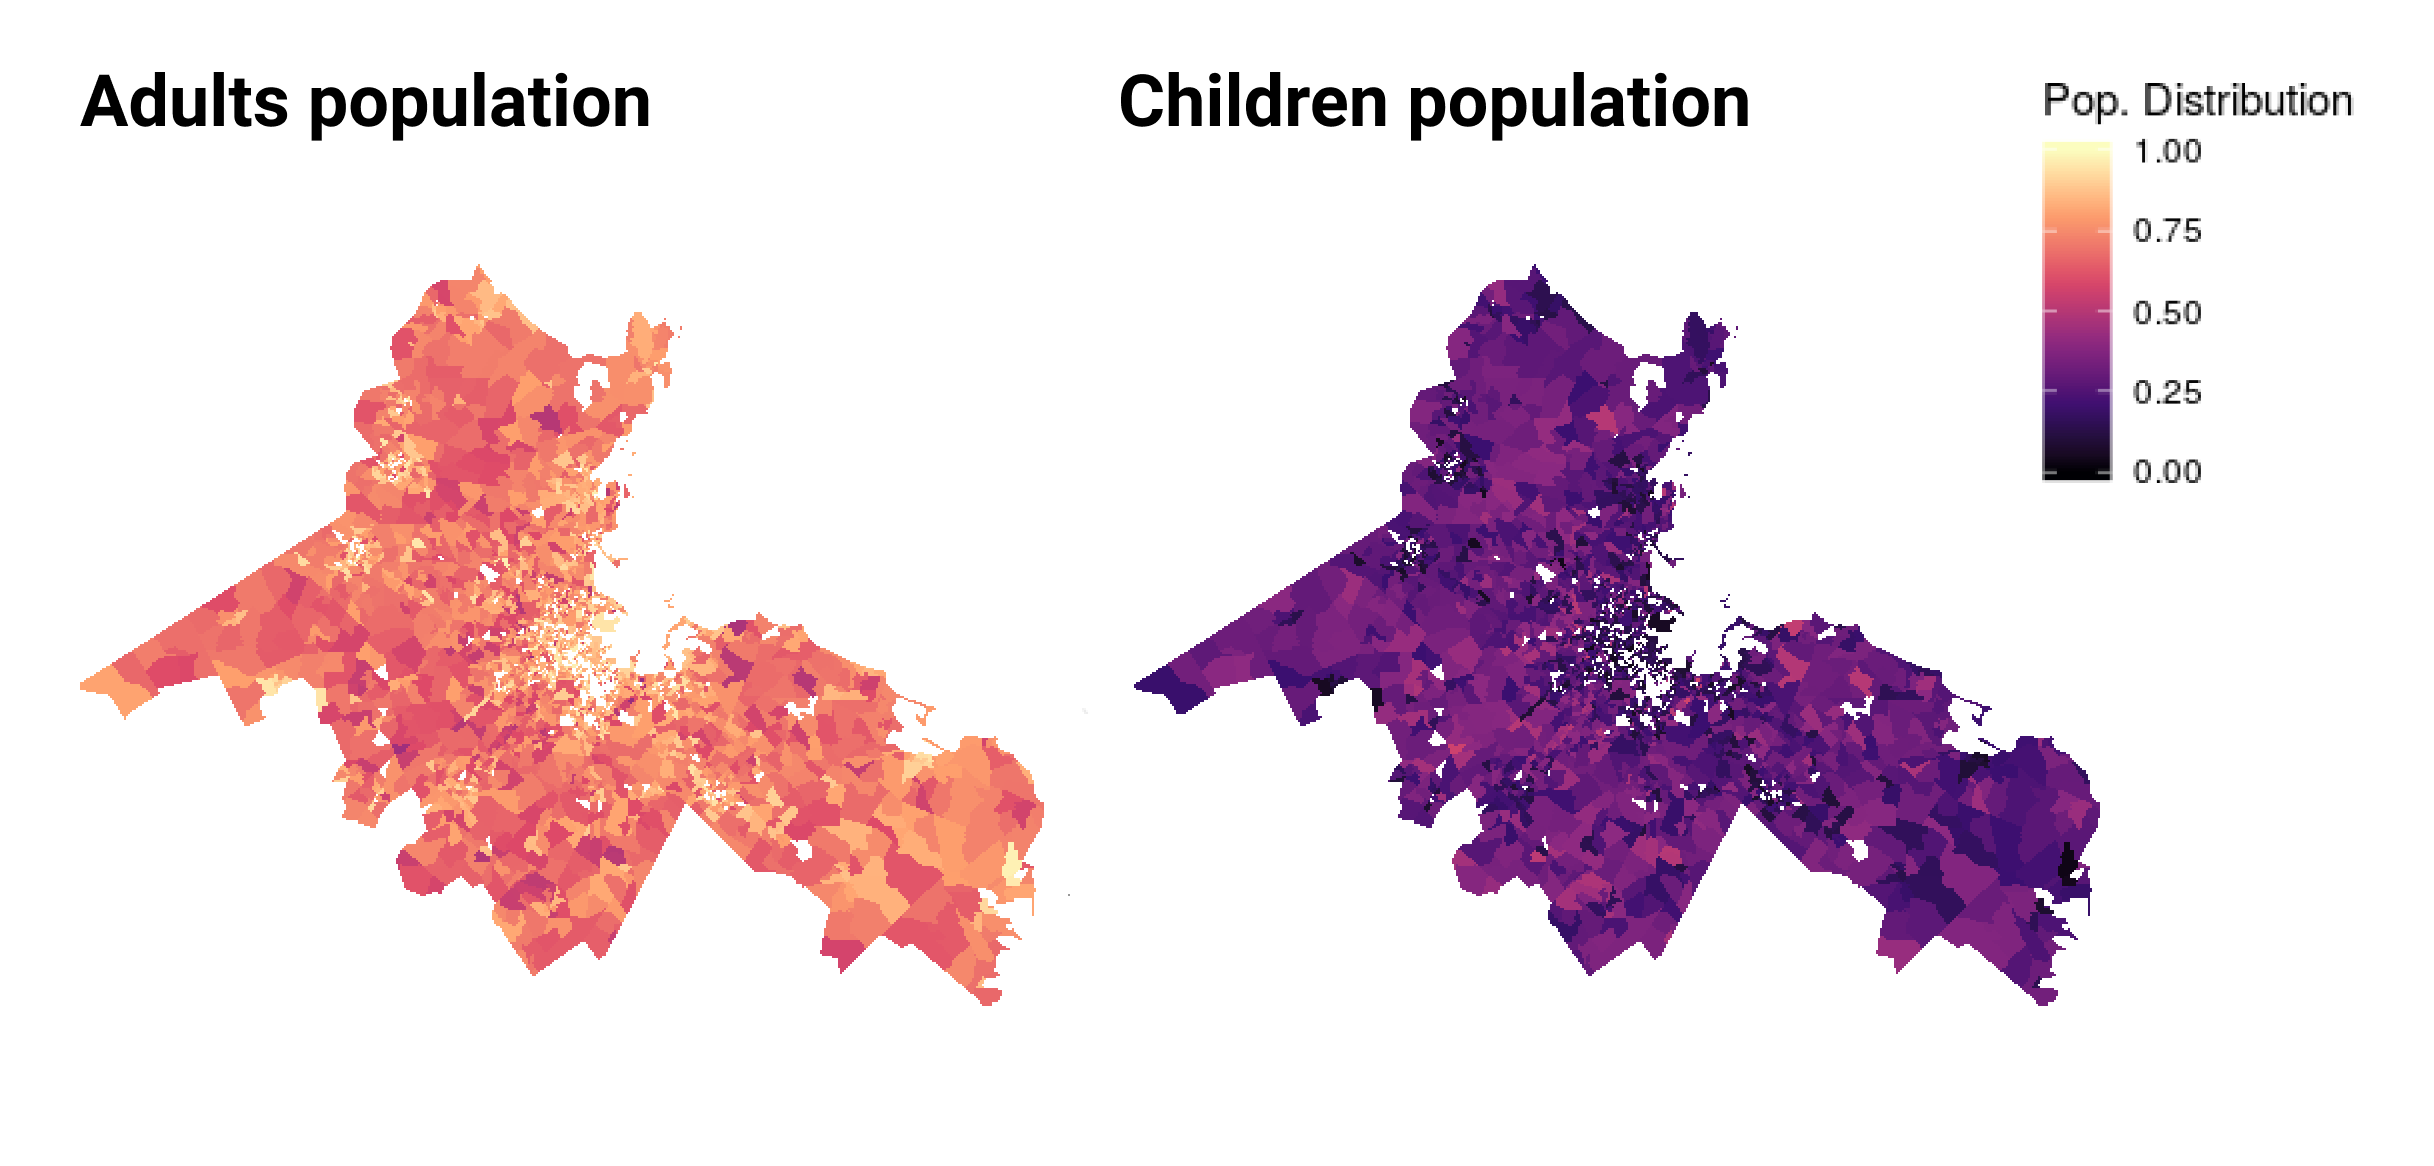
In the previous chart we can see the distribution of adults and children in the population by US Census block groups in the Boston area. The Adult population comes from real world mobility data and children are synthetically generated using the US Census.
Calibrating layer weights using historical ILI data and a SIR model
Initially, the weight of each link measures a different quantity. Links in households and schools have a weight equal to 1. Conversely, links in the community layer are a measure of time, since it is the product of the fraction of time that individuals i and j have been in the same place.
To calibrate the relative importance of each layer we fit a SIR model to the propagation of a typical ILI [1].
SEIR model for modelling the COVID-19 epidemic
With the values obtained in the previous model, we can weight each link by their relative importance in the propagation of a disease that is transmitted by droplets, such as influenza or covid-19.
The next step is to modify the previous model to include the special characteristics of this new disease.
Social distance strategies tested
We explore different social distance strategies:
(i) School closures.
(ii) Self-distancing and remote work.
(iii) Self-distancing and remote work plus School closure.
(iv) Restaurants, nightlife and cultural closures.
(v) Non-essential workplace closures.
(vi) Total confinement.
We test the impact of establishing these strategies at different stages of the epidemic curve and for different periods of time.
Best strategy for minimizing the impact of the COVID-19 epidemic
Based on our analysis, social distancing with 90% of adoption and total non-essential closures are valid strategies for mitigating the outbreak. However, once the restrictions are lifted the risk of having a second outbreak is high. To prevent this situation, active strategies such as massive testing, remote symptoms monitoring, isolation of new cases and contact tracing need to be implemented.
In the following chart, we can see the dynamic of the epidemic if the total confinement is applied. We can see a second outbreak with a large reproductive number.

In the next chart, we can see the effect a 50% adoption of social distancing and school closures. The result of this strategy is that the first peak of the epidemic is not too large, but as soon as the restrictions are lifted there could be a second outbreak. In this case the second peak is smaller due to the reduction of susceptible individuals after the first peak.

In general, we observe that passive mitigation strategies:
-
Reduce the size of the first peak, but can lead to a second peak once restrictions are lifted.
-
Even if the effective reproduction number goes below 1, it can jump above the threshold once restrictions are lifted.
More details about its dynamic:
1) Epidemic trajectory: We can see that the epidemic trajectory keeps at minimum while the strategy endures. That give us time for getting ready and control the second wave with a well defined suppression strategy.
2) Total cases: We can see that the duration of the social distance measures delay the growth of cumulative cases as long as the duration of the restrictions is longer than 30 days.
3) Effective reproduction number: Effective reproduction number: We see that the strategy can reduce the effective reproduction number below 1 to contain the exponetial growth of the epidemic. However, when social distance measures are withdrawn the reproductive number grows exponentially.
4) New infections by layer: We see similar epidemic dynamics between 30 and 90 days, the duration of the measures just keep stable the proportion of new infections by layer while the measures are in place.
5) Infections distribution by layer: Finally, the main proportion of cases take place in the community and workplaces, nearly a 50% of them. However, there are important differences between the situation with and without mitigation strategies. While the restrictions are in place, almost 80% of the infections are produced within households. Once the restrictions are lifted, most new infections take place within the community.
Limitations of the study
-
Social mixing as given by age is not included. This might be important to evaluate CFT and other age-related quantities.
-
Children are not present in the community layer. The impact of this limitation should not be important in most scenarios as they consider confinement at households.
-
The mobility data is biased towards neighborhoods with a larger amount of family households than the average.
-
Currently we do not distinguish between mild and critical cases.
-
Uncertainties on the precise values of several epidemic parameters. This implies that the arrival of the peak or the duration of the restrictions cannot be taken as an exact quantity but an indication of the expected overall behavior. More simulations will be carried out to perform a sensitivity analysis.
-
The population is closed. This limitation is not supposed to be severe as the underlying assumption is that inter-subpopulation mobility is reduced to minimal levels.
-
We build the school layers by mixing children from the same US Census tract.
-
When we implement restrictions over some places, we consider that the relationships in the others are not affected. Similarly, once restrictions are removed, we consider that the population goes back to normal, but it is likely that a significant fraction of individuals will still adopt self-aware measures, such as wearing masks, reducing some unnecessary contacts, etc. However, these can be considered as examples of active measures rather than passive and currently we have not included them in the model.
References
[1] Measurability of the epidemic reproduction number in data-driven contact networks
A extended version of this report can be downloaded here.
Data Protection
This research was solely based on data from anonymized users who have opted-in to provide access to their location data anonymously, through a GDPR-compliant framework. The analysis never singled out identifiable individuals and no attempts were made to link these data to third party data about an individual.
In order to preserve privacy, residential areas are inferred at an aggregated US Census block group, thereby allowing for demographic analysis while obfuscating the true home location of anonymous users and prohibiting misuse of data.
Acknoledgements and Partnerships
This preliminary analysis is a collaboration between the University Carlos III de Madrid, University of Zaragoza, MIT Media Lab, ISI Foundation, Cubeiq Inc. and Zensei Technologies S.L.. In response to the COVID-19 crisis, Cuebiq is providing insights to academic and humanitarian groups through a multi-stakeholder data collaborative for timely and ethical analysis of aggregate human mobility patterns.